- Published on
How to collect custom metrics in ASP.NET application using Application Insights
Metrics offer insights into our application that go beyond standard logging. They provide us with quantitative measurements of our application's performance and behavior.
When we integrate Application Insights into our ASP.NET application, it automatically provides us with HTTP request metrics, which are crucial for assessing performance and availability. But what if we require more detailed metrics specific to our application? For instance, we might need to monitor the duration of certain function calls to pinpoint performance bottlenecks, or perhaps we want to keep tabs on the amount of data we're receiving from an external API.
In all these scenarios, Application Insights offers a custom metric collection API. In this post, we'll create an ASP.NET application and explore how to utilize this custom metric collection feature to gather the specific metrics we need.
Prerequisites
- You should have a basic understanding of Application Insights. Please refer, to Getting Started with Application Insights in case you don't.
- An Application Insights Resource.
Create ASP.NET Application
- Create a new WebAPI project.
- Install the latest Microsoft.ApplicationInsights.AspNetCore NuGet package.
<ItemGroup>
    <PackageReference Include="Microsoft.ApplicationInsights.AspNetCore" Version="2.21.0" />
</Item>
- Now, in Program.cs add Application Insights Telemetry Services and set default metric namespace.
using Microsoft.ApplicationInsights;
using Microsoft.ApplicationInsights.Metrics;
using System.Reflection;

var builder = WebApplication.CreateBuilder(args);

// Add Services
builder.Services.AddApplicationInsightsTelemetry(o =>
{
    o.ConnectionString = "<connection string>";
});

// Set default namespace for all custom metrics
MetricIdentifier.DefaultMetricNamespace = Assembly.GetExecutingAssembly().GetName().Name;

var app = builder.Build();

app.Run();
Collect Custom Metric
In this section, we'll use a custom metric to track the execution time of a function that's likely to be causing performance issues.
To begin, we'll add an endpoint in Program.cs. I have added a GET /Test endpoint and also added SlowFunction(). We'll use this function as our investigation target and will track its execution duration using a custom metric.
app.MapGet("/Test", async () =>
{
    await SlowFunction();
    return Results.Ok();
});

Task SlowFunction()
{
    return Task.Delay(new Random().Next(3000));
}
Now, to track the execution duration of the SlowFunction() update the endpoint as follows.
app.MapGet("/Test", async (TelemetryClient tc) =>
{
    var s = Stopwatch.StartNew();
    await SlowFunction();
    s.Stop();

    tc.GetMetric("SlowFunctionExecutionDuration").TrackValue(s.Elapsed.TotalMilliseconds);

    return Results.Ok();
});
The first thing to note here is that I have injected the TelemetryClient into the endpoint handler. TelemetryClient will be available as we have installed the Application Insights NuGet package.
Next, I measured the execution time using the Stopwatch.
Then, I used the GetMetric() method to get a handle on a metric with ID SlowFunctionExecutionDuration and then we tracked the duration value.
Keep in mind that this metric ID can be customized to any name of your choice. This method checks if the metric already exists; if not, it creates a new one and returns a handle to it
Similar to GetMetric() there is another method TrackMetric(), the only difference between these two methods is that the GetMetric() method performs local aggregation and then submit the aggregated metric at a fixed interval of one minute whereas TrackMetric() sends telemetry for each single metric value. This can lead to network congestion and request throttling in case of high traffic.
View Metrics
- Execute the endpoint multiple times and let the application run for a few minutes to ensure that telemetry data is sent to Azure.
- Then, open Azure Portal and go to Application Insights Resource.
- In the sidebar, under the Monitoring section, click on Logs to open Log Analytics.
All custom metrics are stored in customMetrics table, so let's query the table to view the values.
customMetrics
| where name == 'SlowFunctionExecutionDuration'
| order by timestamp desc
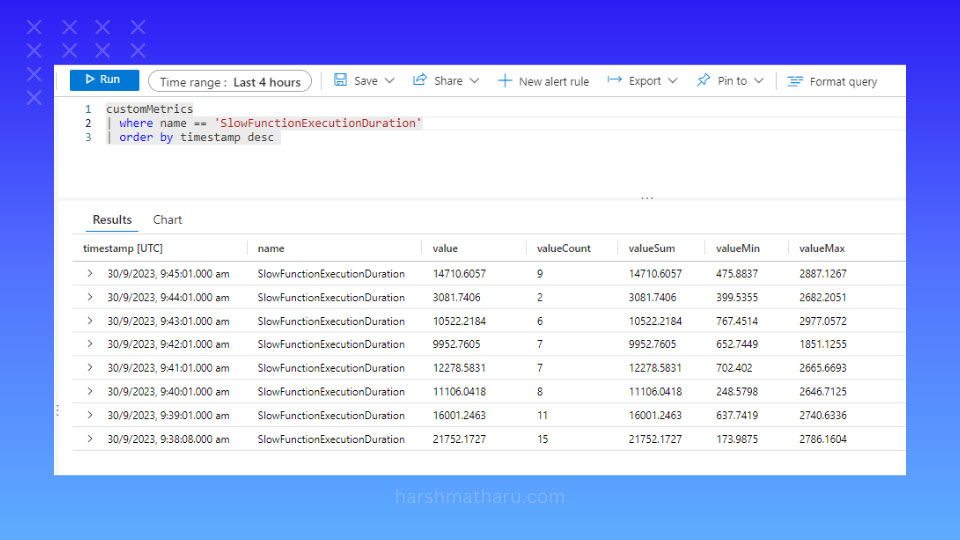
We can see multiple metric entries, aggregated by one-minute time intervals. Within these entries, the value column represents the sum of all the metric values for that particular time frame, while valueCount represents the number of metrics recorded during that period. Also, we can see the minimum and maximum values during that interval.
However, for our specific analysis, these aggregated values may not offer the clarity we need. To derive more meaningful insights, we can compute the average execution duration within each interval by dividing the value by valueCount.
customMetrics
| where name == 'SlowFunctionExecutionDuration'
| project avgDuration = (value / valueCount), value, valueCount, timestamp
| order by timestamp desc
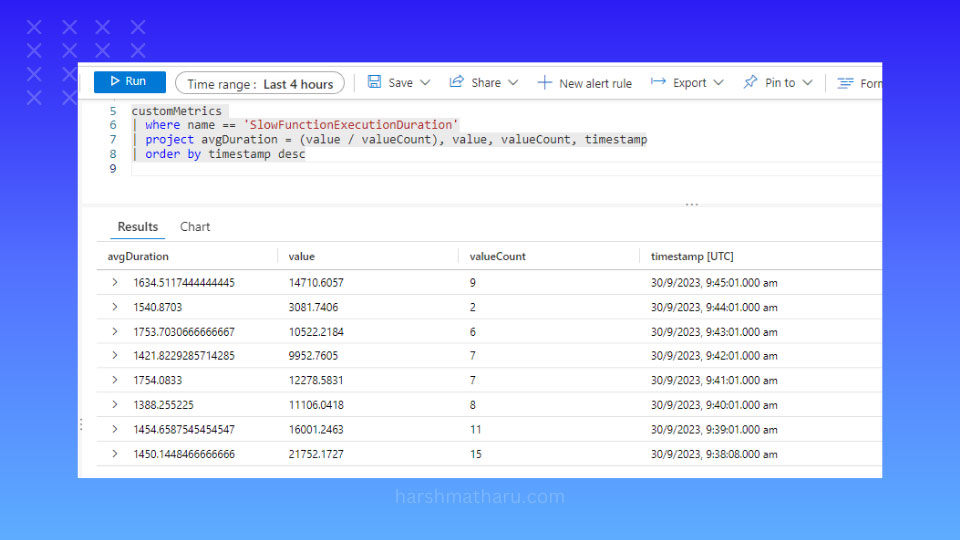
This provides a clearer view: now we can easily view the average duration of our SlowFunction() within each time interval, which is around ~1500 milliseconds. We can further reduce this information into a single value using the following query.
customMetrics
| where name == 'SlowFunctionExecutionDuration'
| summarize  totalDuration = sum(value), totalRequests = sum(valueCount)
| project totalDuration, totalRequests, avgRequestDuration = totalDuration / totalRequests
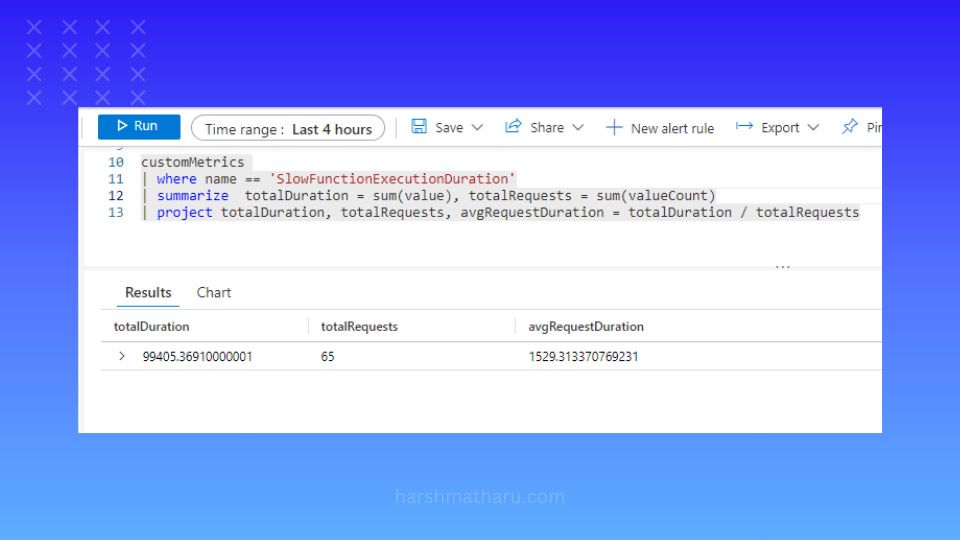
Now, we have a single numerica value, revealing the average duration of our SlowFunction() to be approximately ~1529 milliseconds.
Conclusion
With the metrics collected, we can visualize and analyze them within the Azure Portal, making informed decisions and optimizations. The ability to access metrics, and extract meaningful data offers a comprehensive understanding of our application's behavior.
In conclusion, custom metrics are a powerful tool in the arsenal of any developer or operations team, enabling them to tailor monitoring to the specific needs of their application and extract actionable insights for continuous improvement.