- Published on
Getting Started with Application Insights and Integrating with ASP.NET Application
Table of Contents
- Features of Application Insights
- Logs
- Live Metrics
- Distributed Tracing
- Application Map
- Availability
- Smart Detection
- Profiler
- Snapshot Debugger
- Integrating Application Insights with ASP.NET Application
- Auto Instrumentation
- Example of Auto Instrumentation
- Publish WebApi to Azure App Service
- Enable Application Insights
- Application Insights NuGet Package
- FAQs
- What kind of telemetry does Application Insights collect?
- Can I use single Application Insights for multiple apps?
- Conclusion
Application Insights is part a of the Azure Monitor ecosystem and provides Application Performance Monitoring (APM) features.
We can capture complete telemetry data of an application with it such as logs, metrics or traces.
If you are deploying your applications to Azure then monitoring solution such as Application Insights is a must have.
Features of Application Insights
Here are some key highlights of Application Insights:
- Logs
- Live Metrics
- Distributed Tracing
- Application Map
- Availability
- Smart Detection
- Profiler
- Snapshot Debugger
Logs
Application Insights collects and sends log data to Log Analytics Workspace.
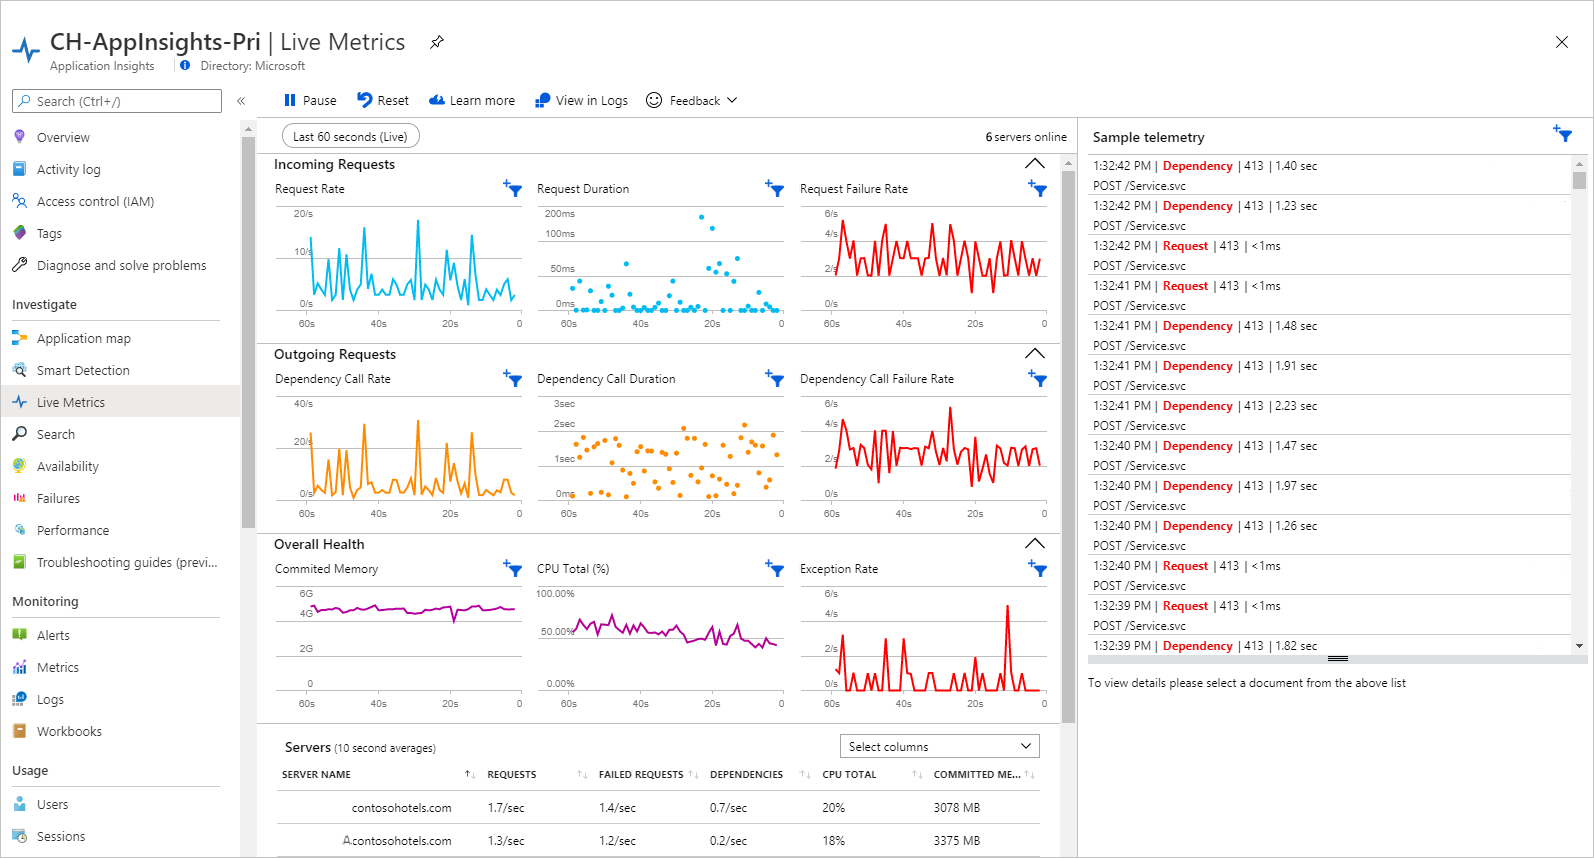
Live Metrics
We can observe real-time metrics from our application.
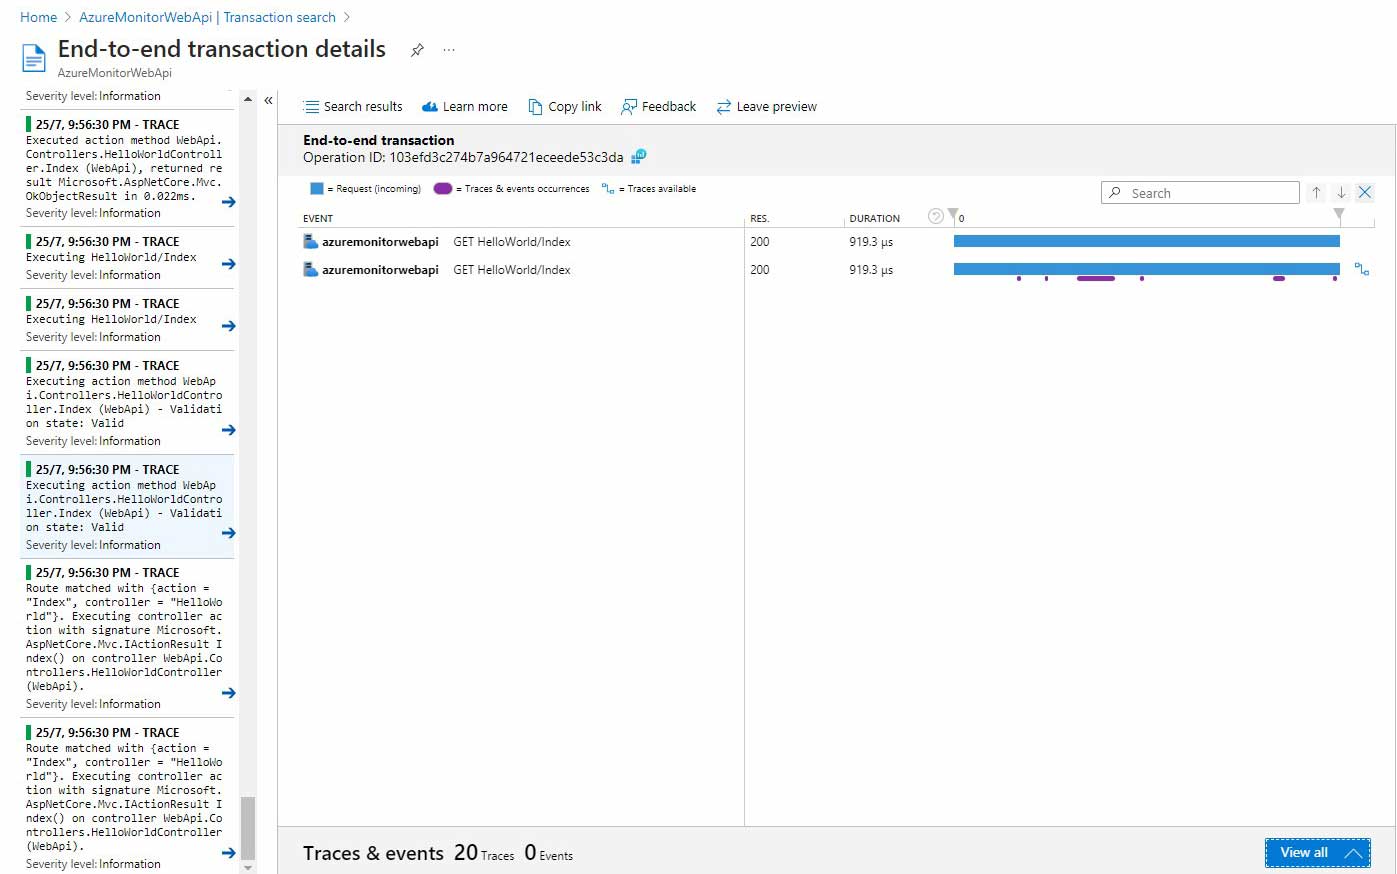
Distributed Tracing
We can view distributed traces with Transaction Search feature of Application Insights. It shows application requests as they flow from various different components in our application in a time-sequence list. It helps us troubleshoot components in a distributed request which exhibit high latency or throw errors.
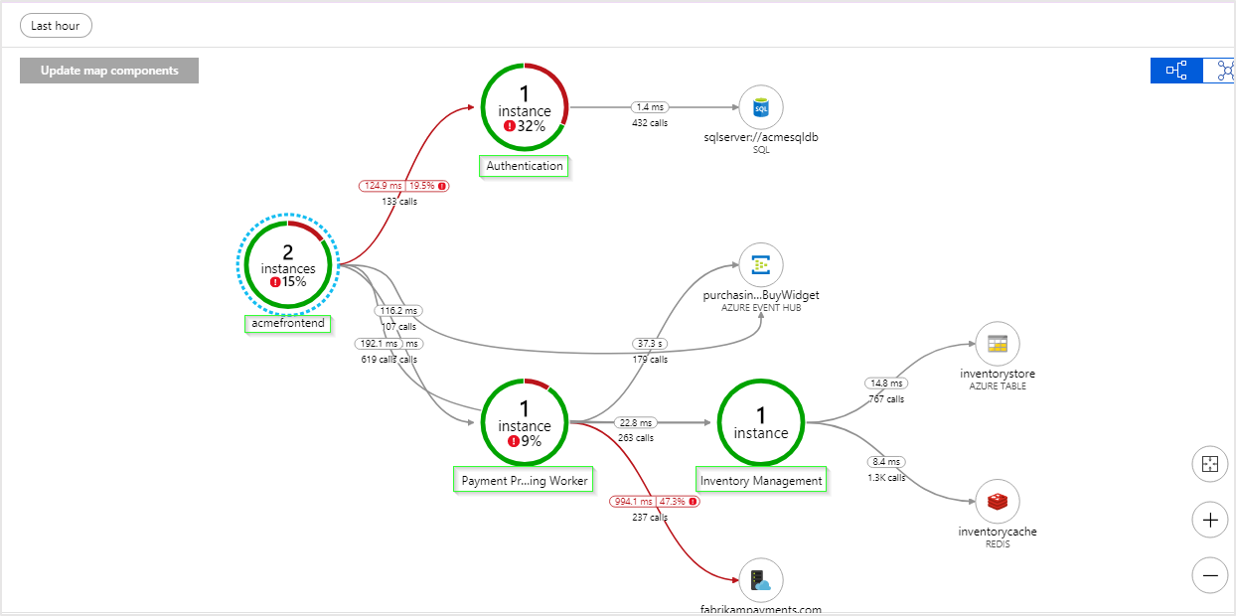
Application Map
Application Map is a graphical visualization of various components in the application such as various microservices, database etc. It allows us to view high-level view of the application architecture, specifically our application and its dependencies. We can view component's health and responsiveness at-a-glance.
Availability
Once we've deployed our application, we can set up recurring tests to monitor application's availability. Application Insights sends web requests to our application at regular intervals to check it's availability and it alerts us if our application isn't responding or responds too slowly.
Smart Detection
Application Insights detects sudden rise in failure and abnormal patterns in the application and sends us an alert.
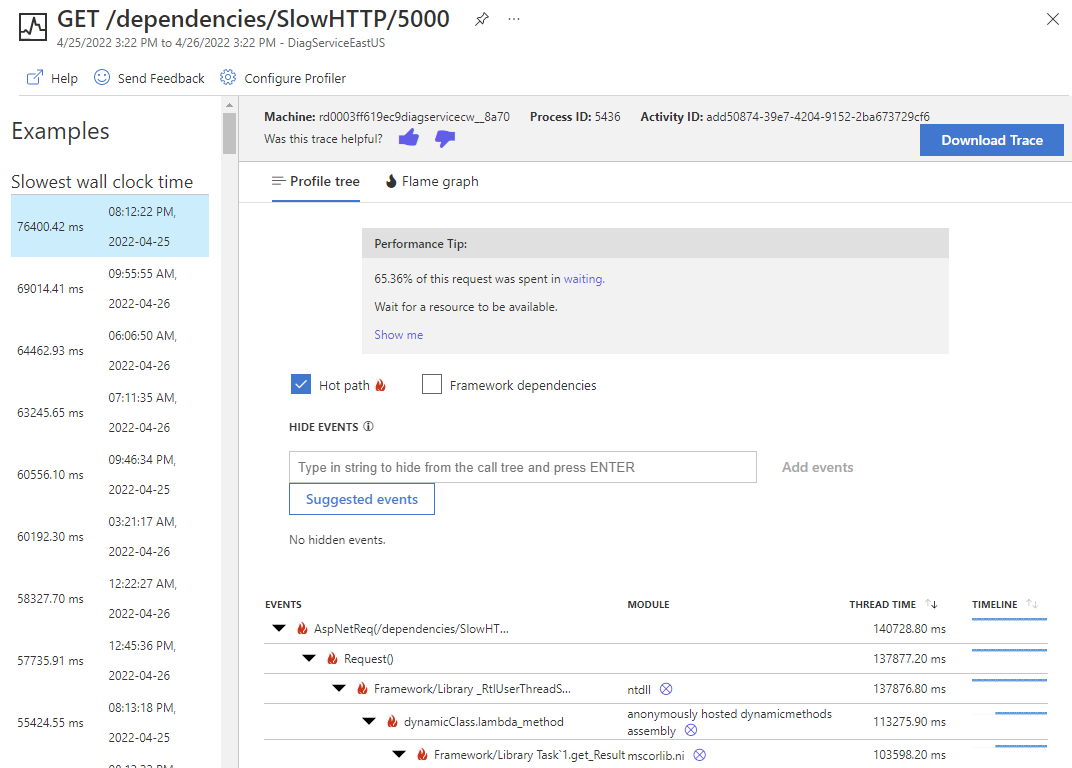
Profiler
Application Insights provides Application Profiler, with it, we can capture and view performance traces of our application in production. Once we enable the profiler it starts once an hour or after certain threshold is met and then captures the call stack.
Snapshot Debugger
With Snapshot Debugger, we can collect a debug snapshot when an exception occurs in our application. The debug snapshot shows the state of source code and variables at the moment the exception was thrown.
These are only a few of the features which Application Insights provide and you can use all of these features with very simple integration.
Let's look at how we can integrate Application Insights with our ASP.NET application.
Integrating Application Insights with ASP.NET Application
There are two ways to integrate Application Insights:
- Auto Instrumentation
- Using Application Insights NuGet Package
Auto Instrumentation
In Auto Instrumentation, code is automatically instrumented without any code or config change. But Auto Instrumentation is only supported for few scenarios which are mentioned below. You can checkout the full list of supported scenarios here.
| Resource | .NET Framework | .NET Core/.NET |
|---|---|---|
| Azure App Service (Windows) | ✅ | ✅ |
| Azure App Service (Linux) - Published as Code | ❌ | ✅ |
| Azure Functions - basic | ✅ | ✅ |
| Azure VMs Windows | ✅ | ✅ |
| Azure Kubernetes Service (AKS) | ❌ | ❌ |
As you can see in the table, if we have deployed our ASP.NET application in Azure App Service (Windows) then we just have to enable Application Insights from the Settings and that's it. Telemetry data from our application will start flowing into the Application Insights automatically.
Example of Auto Instrumentation
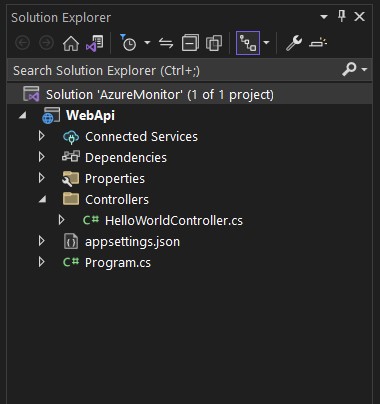
Create a basic ASP.NET WebApi application.
var builder = WebApplication.CreateBuilder(args);

builder.Services.AddControllers();

var app = builder.Build();

app.UseHttpsRedirection();

app.MapControllers();

app.Run();
using Microsoft.AspNetCore.Mvc;

namespace WebApi.Controllers;

[Route("api/[controller]")]
[ApiController]
public class HelloWorldController : ControllerBase
{
    private readonly ILogger<HelloWorldController> logger;

    public HelloWorldController(ILogger<HelloWorldController> logger)
    {
        this.logger = logger;
    }

    [HttpGet]
    public IActionResult Index()
    {
        logger.LogInformation("Executing HelloWorld/Index");

        return Ok("Hello World");
    }
}
{}
Now, lets publish this app using one of the supported scenario for auto-instrumentation i.e. using Azure App Service (Windows).
Publish WebApi to Azure App Service
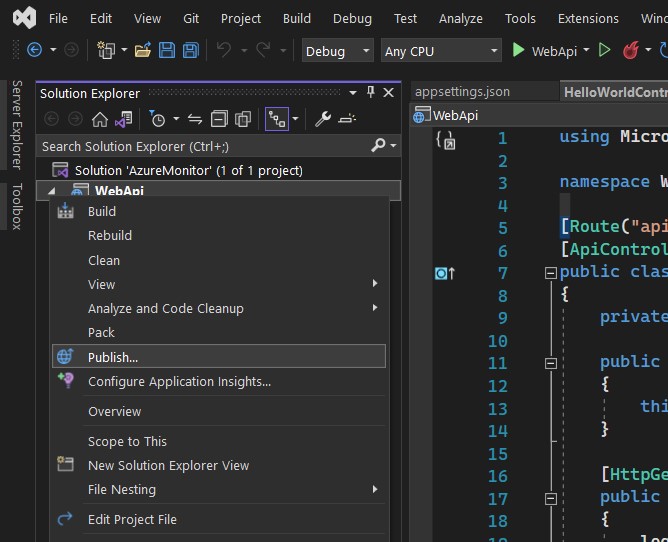
Right click on the project and select Publish.
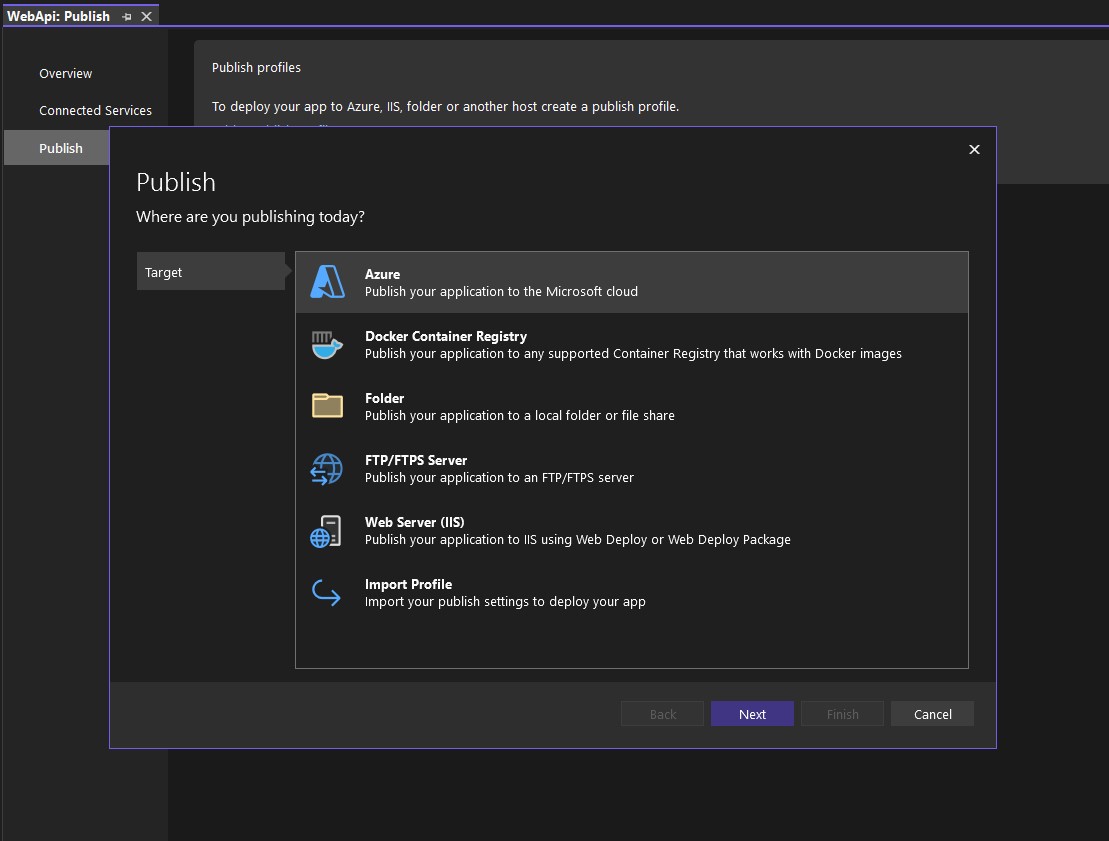
Next, select Publish target as Azure
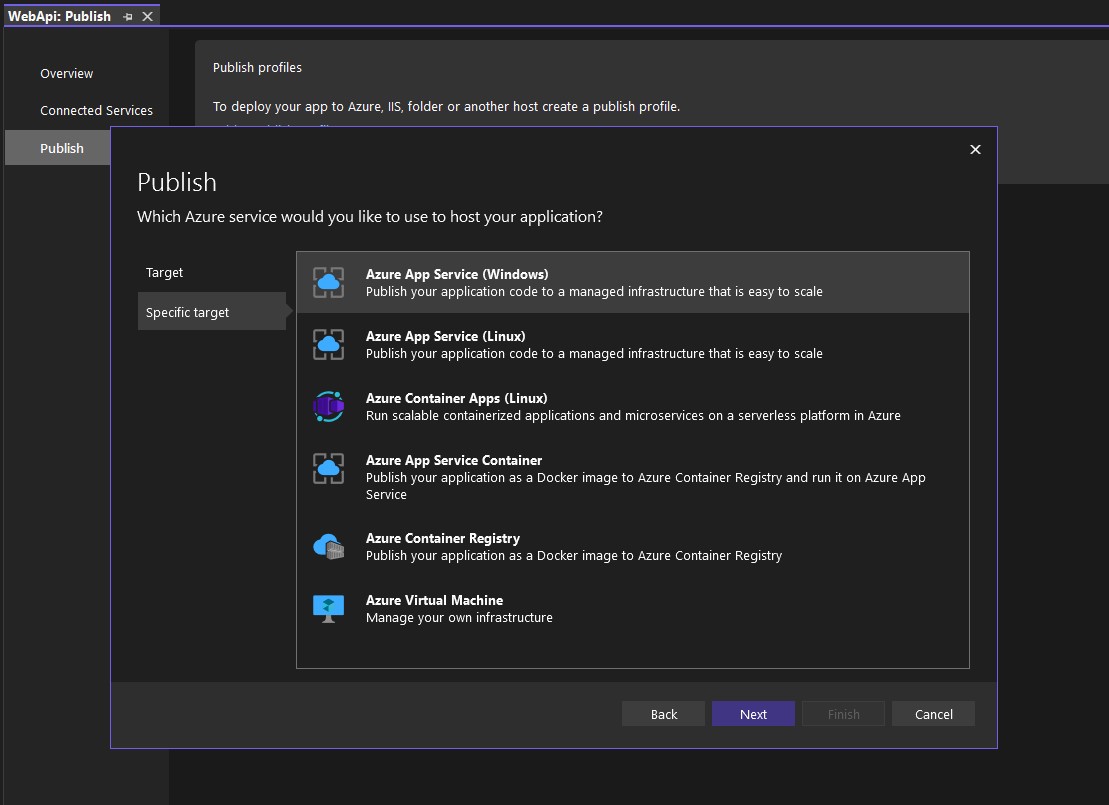
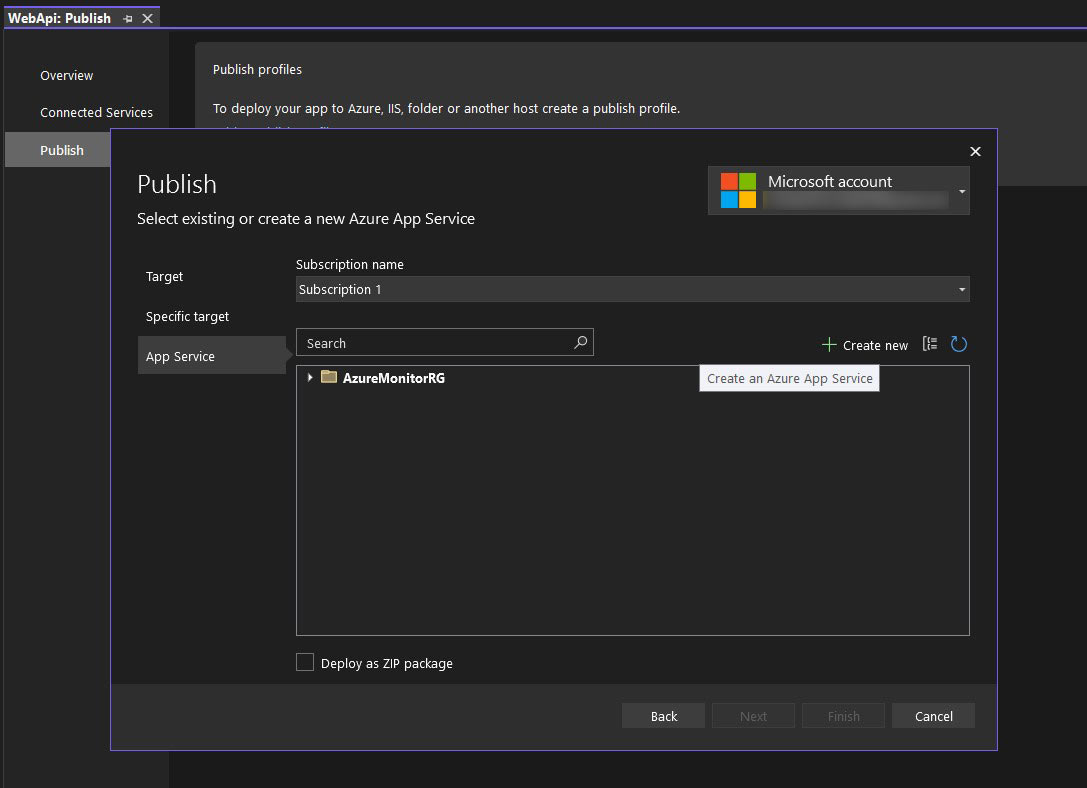
Next, select Azure App Service (Windows) as Specific target.
Now, we have to create a new Azure App Service resource. Click on + Create new button.
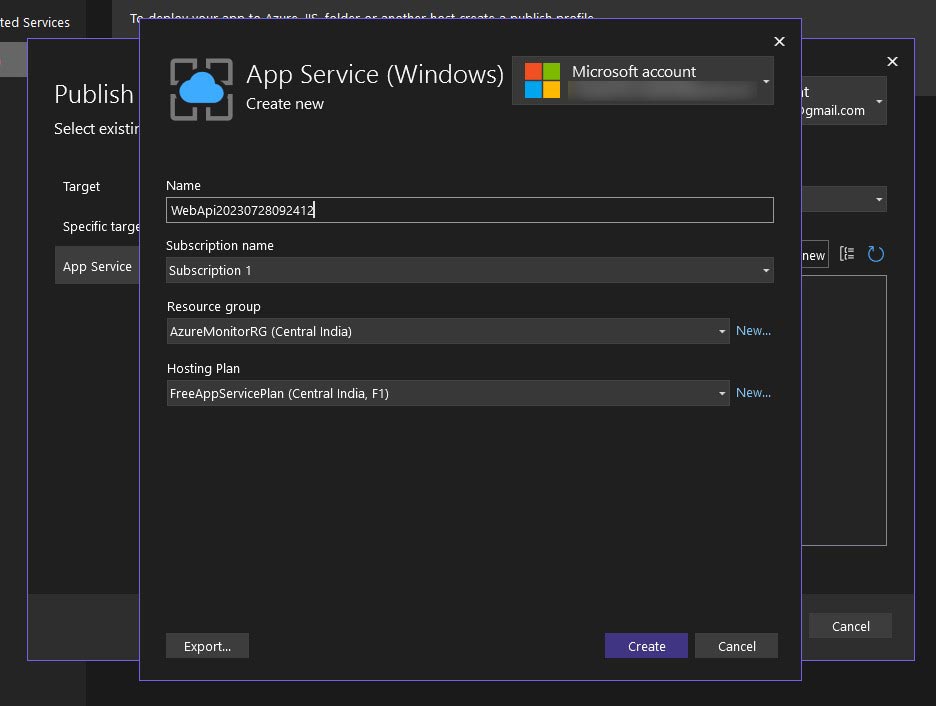
Next, fill the required details and click Create.
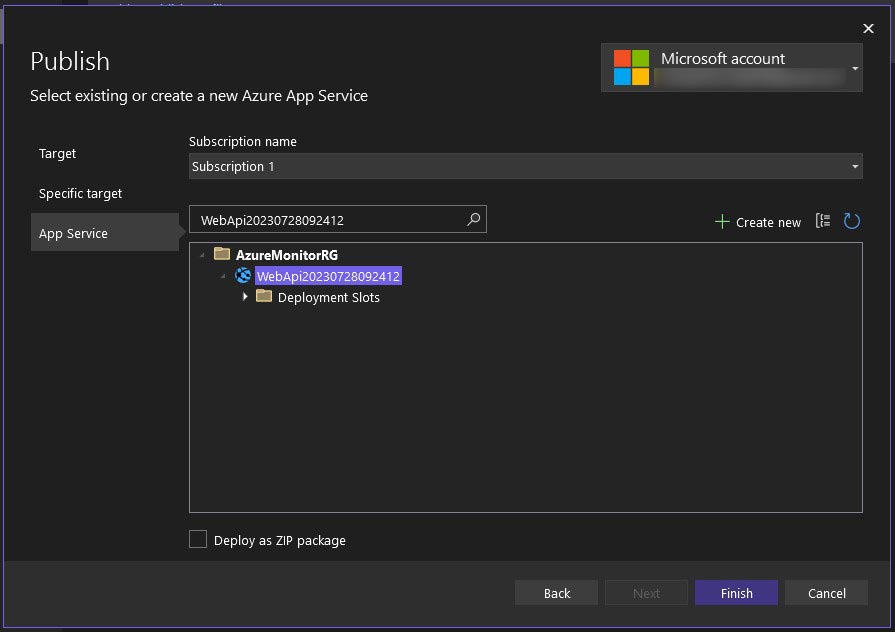
Now, Azure App Service resource has been created. Select that resource from the list and then click Finish.
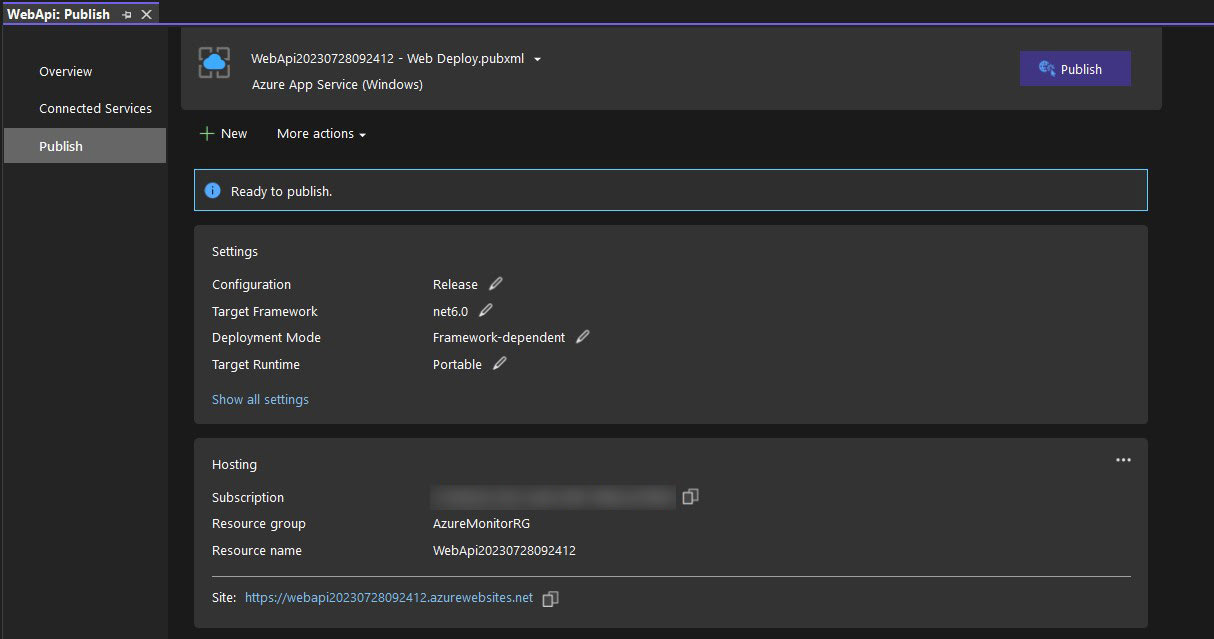
Now, click on Publish and wait for a minute or two and our application will be deployed to Azure App Service.
Enable Application Insights
We have deployed our basic ASP.NET WebApi application to Azure App Service. Now all we need to do is to enable Application Insights.
By enabling Application Insights, I mean, to connect an Application Insights resource to our application. In these steps we are going to create an Application Insights resource. If you already have one created, you can use that too.
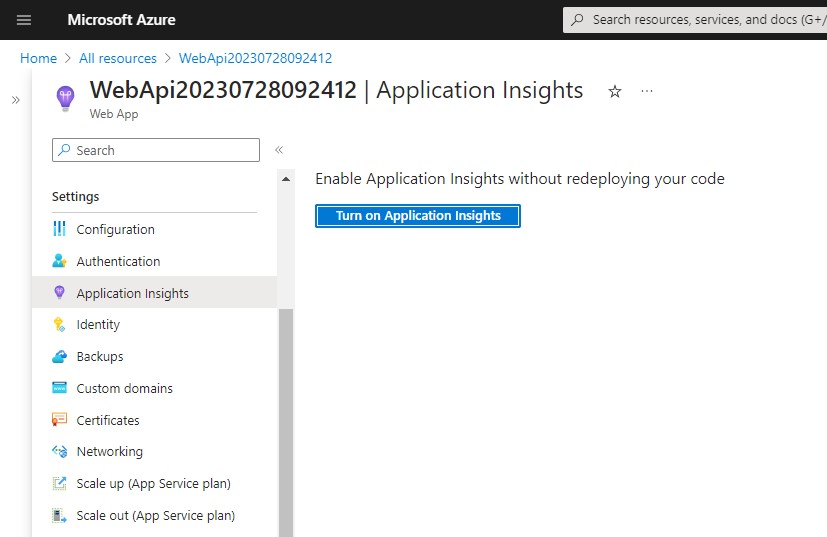
Open the App Service resource and in the sidebar under Settings section click on Application Insights. And then click on Turn on Application Insights.
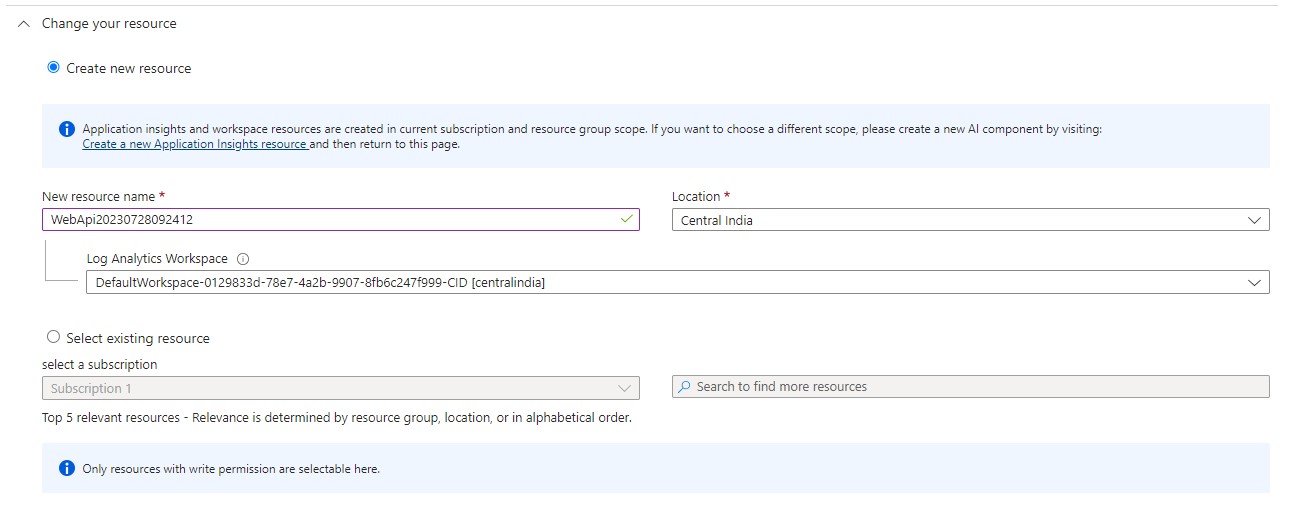
In this page we have to specify the details for the Application Insights resource which will be created. If you already have one running, you can choose the Select existing resource option.
Application Insights' data is stored in Log Analytics Workspace, so that will be created too.
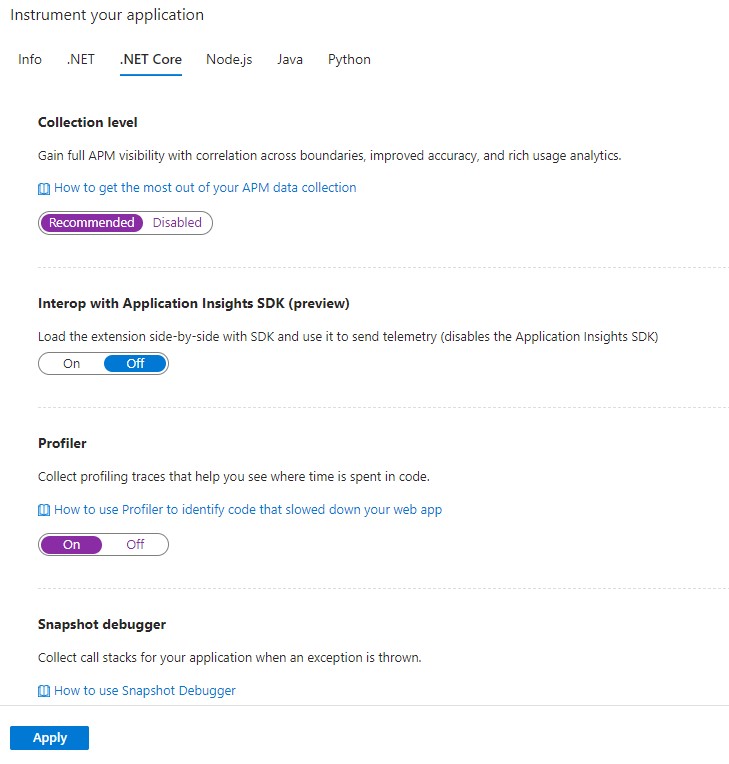
- Further, we can also customize some settings related to our application stack under Instrument your application section. But for now leave it as default and click Apply.
Integration is complete. Now if we use our application and it's telemetry data will flow to Application Insights. You can open the Application Insights resource which was created in previous steps and see some default metrics in the Overview page.
It takes some time for the data to be propagated. So wait for a few minutes and then refresh the page.
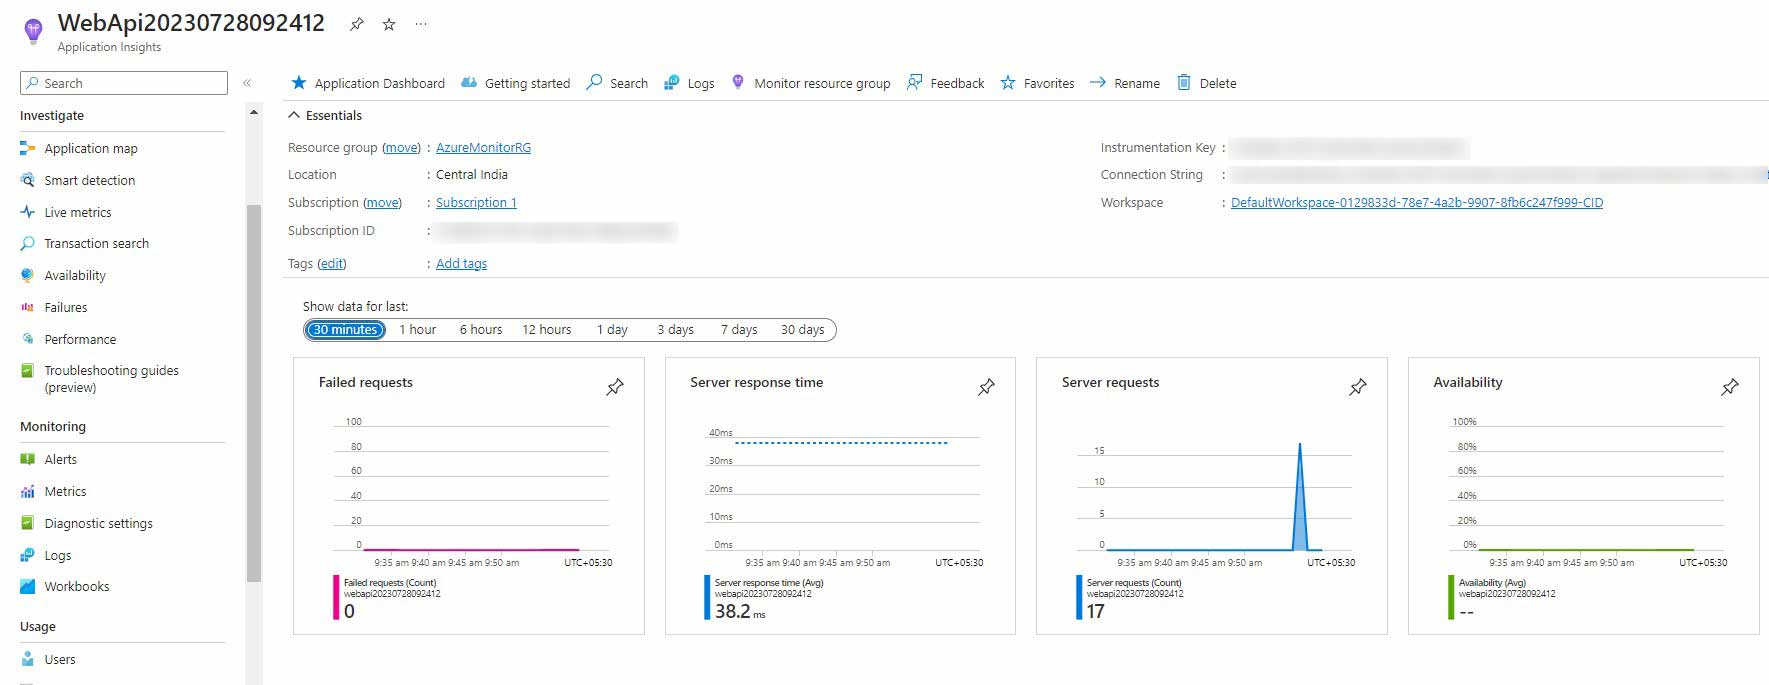
Now you can start exploring some of the features of Application Insights such as Application Map, Transaction Search, Performance. These all are present in the sidebar menu as you can see in the above image.
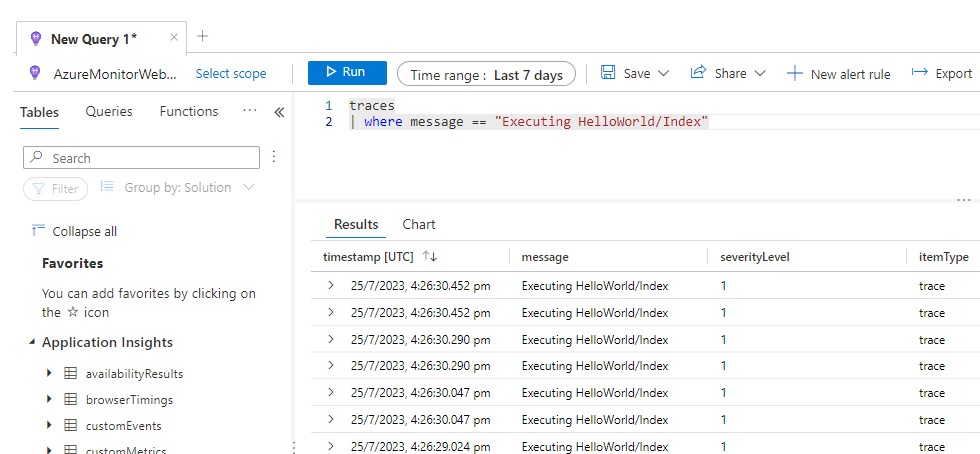
For example, to view Logs from the application click on Logs and view data from the traces table.
Application Insights NuGet Package
If you want to do some custom stuff or your scenario does not support auto instrumentation then you have to use Application Insights NuGet package.
- Install the latest Microsoft.ApplicationInsights.AspNetCore NuGet package.
<ItemGroup>
    <PackageReference Include="Microsoft.ApplicationInsights.AspNetCore" Version="2.22.0-beta3" />
</ItemGroup>
- Then update the Program.cs file and add
builder.Services.AddApplicationInsightsTelemetry();method call.
var builder = WebApplication
    .CreateBuilder(args);

builder.Services.AddControllers();
builder.Services.AddApplicationInsightsTelemetry();

var app = builder.Build();

app.UseHttpsRedirection();

app.MapControllers();

app.Run();
- Update appsettings.json with the Application Insights connection string.
You can find Application Insights connection string in the Overview page of the Application Insights resource.
{
  "ApplicationInsights": {
    "ConnectionString": "<connection string>"
  }
}
That's it. Now you can deploy your application anywhere you like throughout the Azure platform and the telemetry from the application will be collected by the Application Insights.
FAQs
What kind of telemetry does Application Insights collect?
- Http requests
- Application dependency tracking
- Logs
- Exceptions and stack trace
- Performance Counters
- Custom events and metrics
Can I use single Application Insights for multiple apps?
Yes, you can. You should use one Application Insights resource for applications and components which logically belongs to one group. You should use separate resources for your dev/prod environments.
Conclusion
In conclusion, with Application Insights, you can easily integrate Logs, Metrics, Distributed Tracing, and more into your applications, providing you with valuable insights into your application's behavior and performance.
Integrating Application Insights with an ASP.NET application is straightforward, offering two options: Auto Instrumentation and using the Application Insights NuGet package. The Auto Instrumentation automatically instruments the code and provides telemetry in supported scenarios. On the other hand, the NuGet package allows for more customization and is suitable for scenarios where auto instrumentation is not supported.
By enabling Application Insights in your application, you gain access to valuable telemetry data that can help you monitor and optimize your application's performance, identify issues, and ensure a smooth user experience. Whether you are using .NET Framework or .NET Core/.NET, Azure App Service, Azure Functions, or Azure VMs, Application Insights provides a powerful telemetry service that is easy to integrate and delivers actionable insights into your application's behavior. So, start using Application Insights today and take your application monitoring to next level.