- Published on
How to enable and view logs from Cosmos DB
Table of Contents
Create Log Analytics Workspace
We will export our logs to Log Analytics Workspace so we will need a workspace. If you already have a workspace, then you can skip this section.
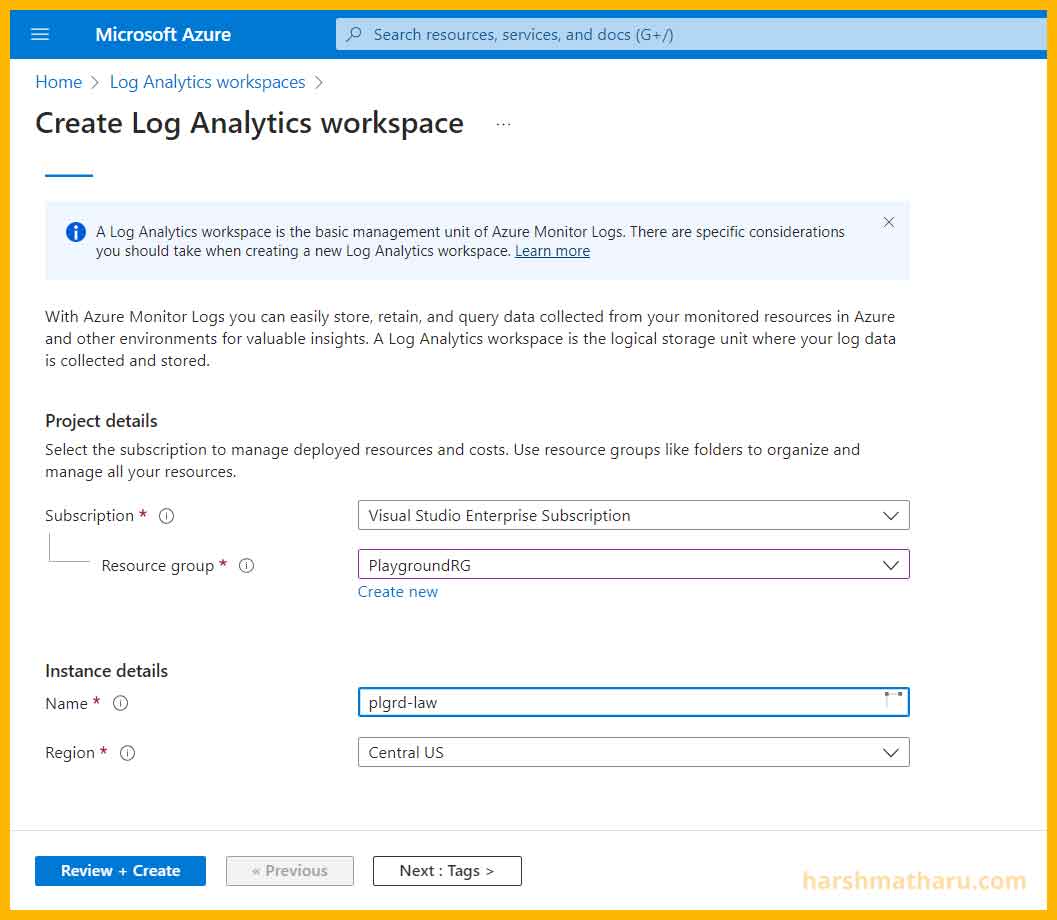
Search for Log Analytics workspace and click Create to create a new resource.
Enter the required details and click Review + Create and then Create.
Enable logs from Cosmos DB
In order to export logs from cosmos DB we need to create a Diagnostic setting.
Creating a Diagnostic setting
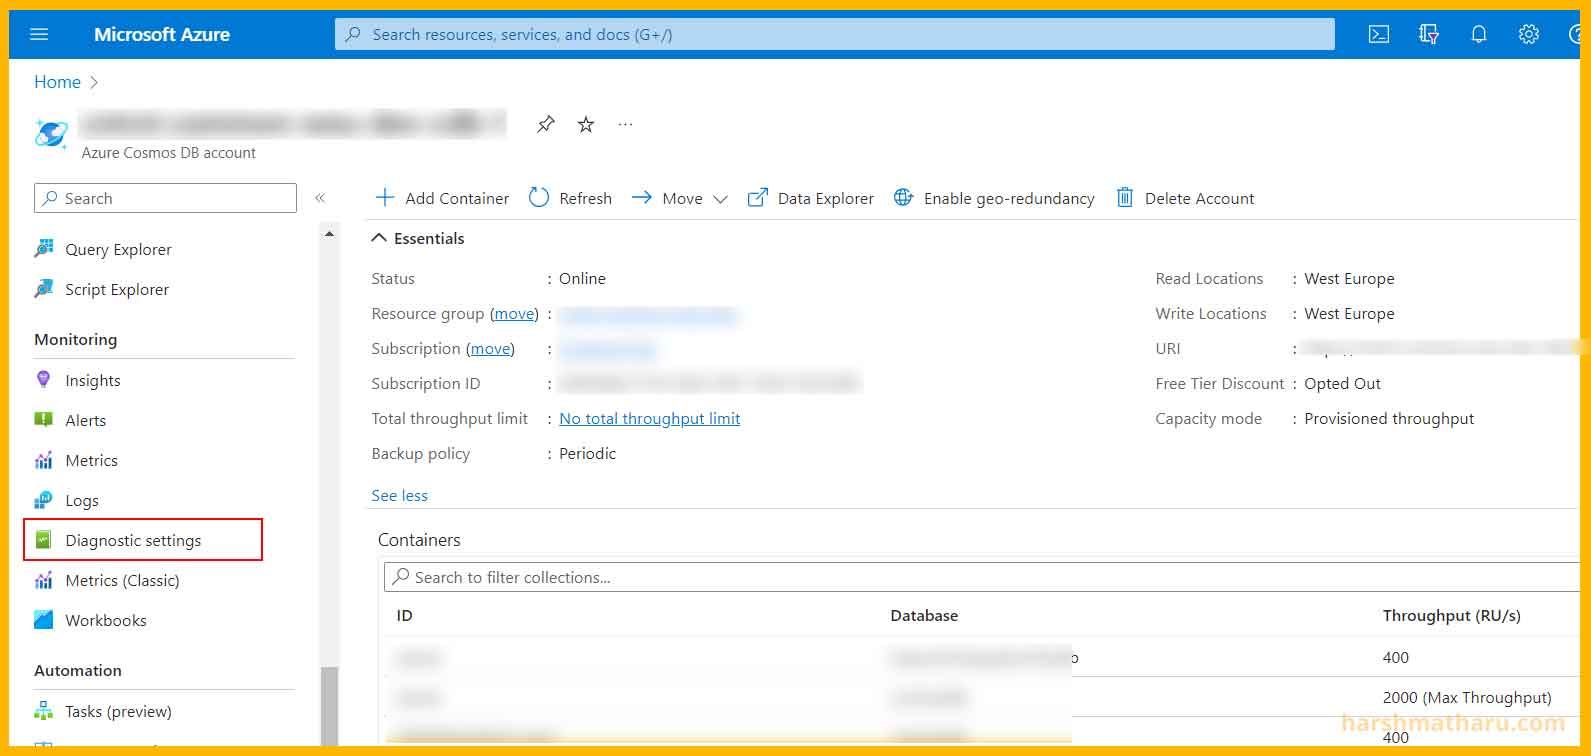
In your Azure portal, go to Cosmos DB resource and click on the Diagnostic settings menu under the Monitoring section of the sidebar.
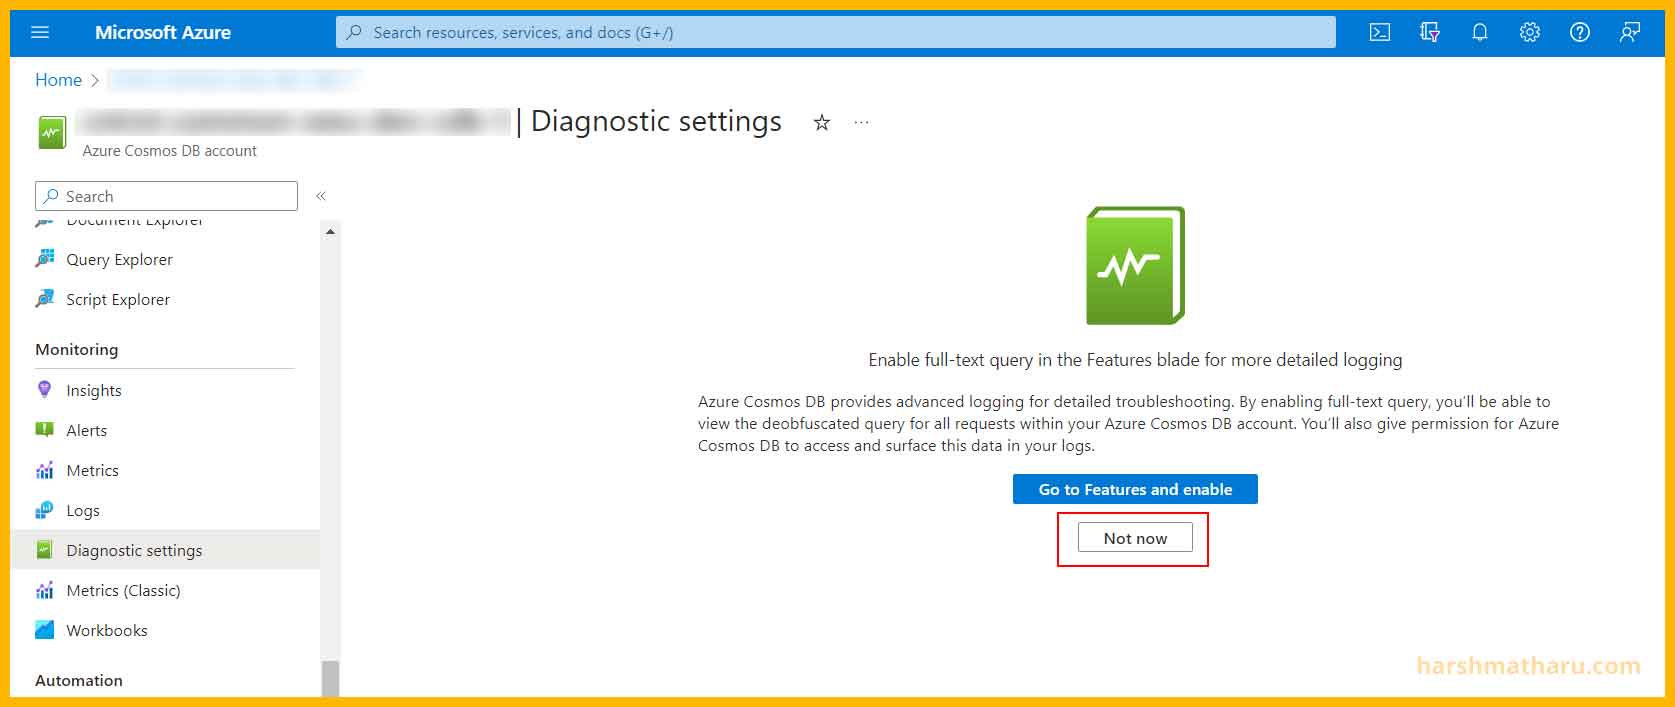
Click on Not now to proceed to the Diagnostic settings page.
On this page, click on the + Add diagnostic setting button.
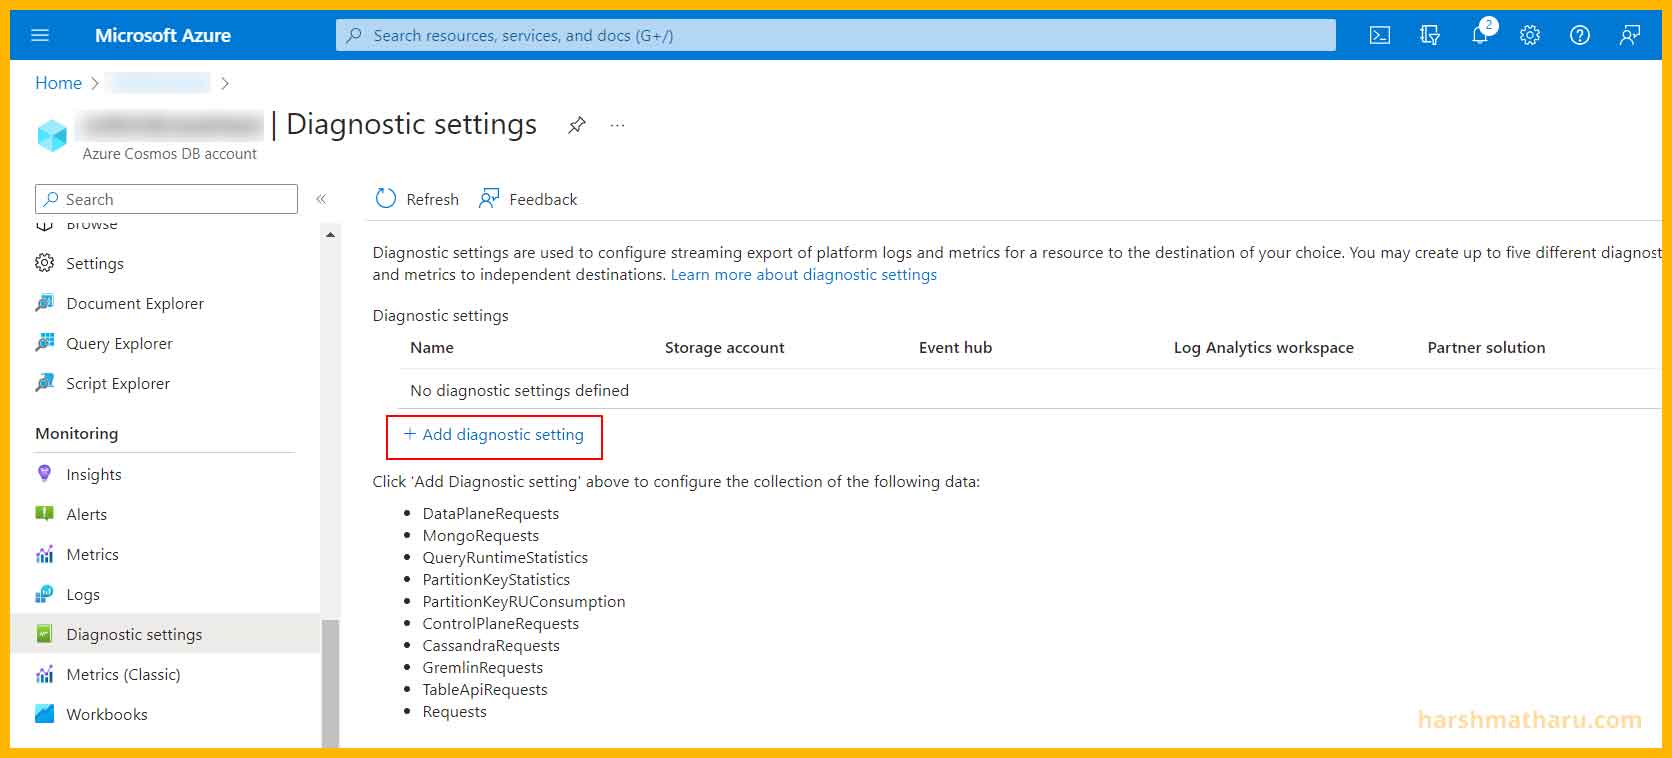
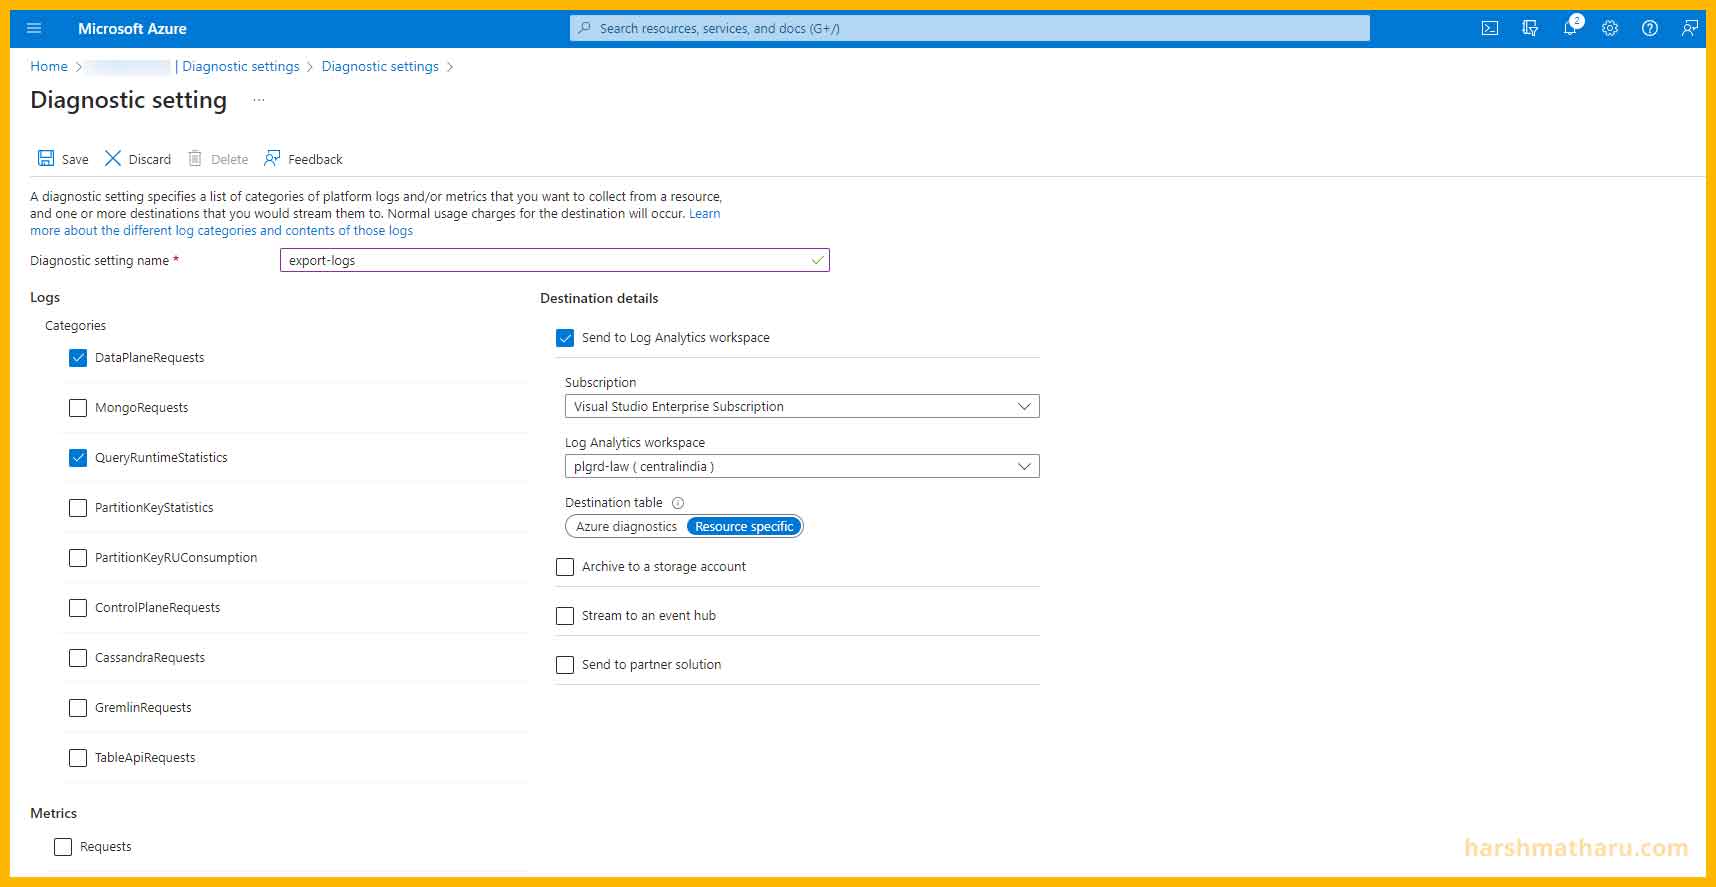
Here we will configure how we want to export cosmos db logs.
First, enter a name for the diagnostic setting. We can have multiple diagnostic settings with different configurations.
Next, we have to select categories. Basically each category represents a different kind of log being exported.
| Category | Description |
|---|---|
| DataPlaneRequests | Logs all operations related to creation, updation, deletion or retrieval of data. |
| QueryRuntimeStatistics | Logs query text, container name, database name etc. |
| ControlPlaneRequests | Logs information regarding account level operations |
| MongoRequests,CassandraRequests,GremlinRequests,TableApiRequests | Choose this option if you are using any of this database API. Make sure DataPlaneRequests are disabled when you are using one of them. |
| PartitionKeyStatistics, PartitionKeyRUConsumption | Logs statistics regarding partition keys. |
In our case, we only need DataPlaneRequests and QueryRuntimeStatistics.
Choose Destination as the Log Analytics workspace which we created.
Select, Destination table as Resource specific.
Click on Save and our Diagnostic setting will be created.
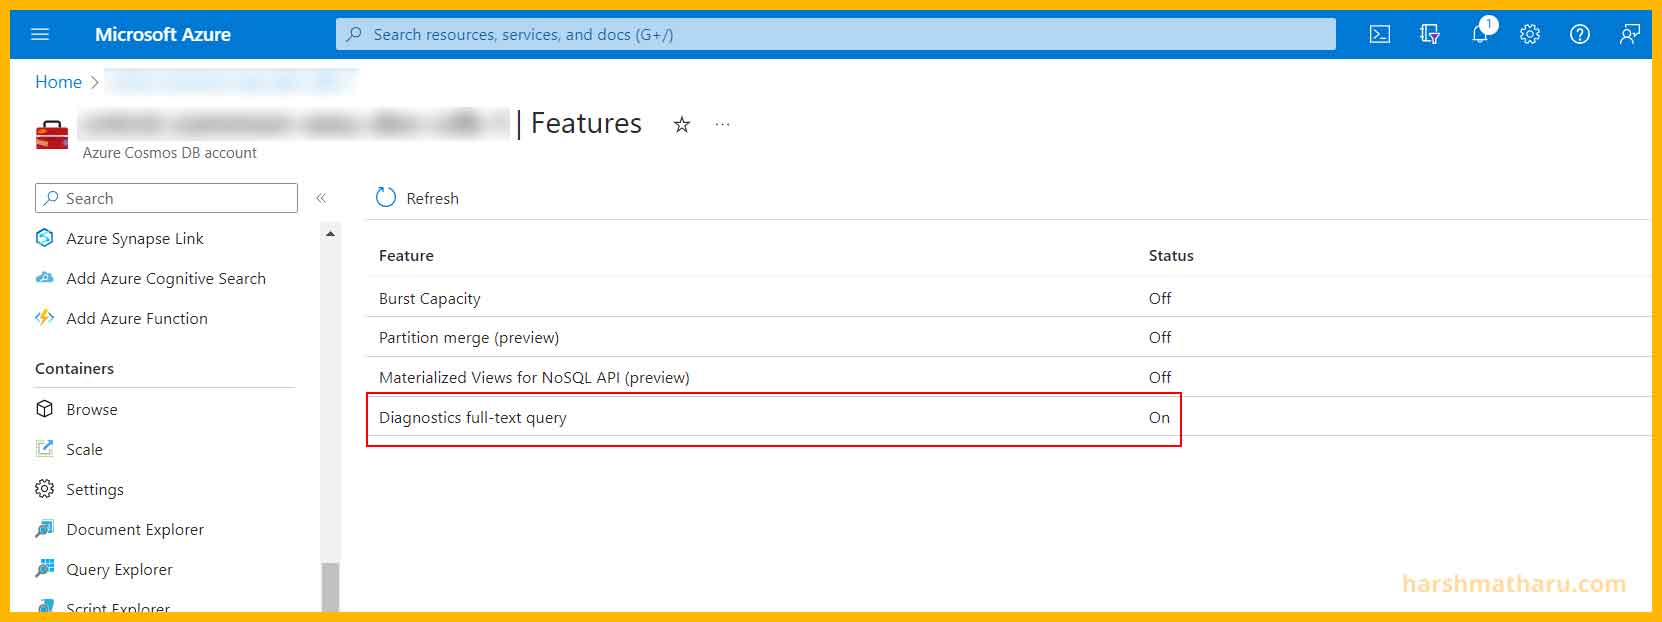
But that’s not it, we need to take one more step. Reopen the Diagnostic setting page and this time click on Go to features and enable button.
You will see that Diagnostics full-text query is set to off. Click on it and enable it. By default a query is not exported to logs but by enabling this option queries will also be exported.
Now we are all set.
View Cosmos DB logs
Go to your Log Analytics Workspace and then from the sidebar click on Logs. Under the Tables tab expand LogManagement, there you will see table names starting with CDB. These all are Cosmos specific tables and all logs are stored in these tables.
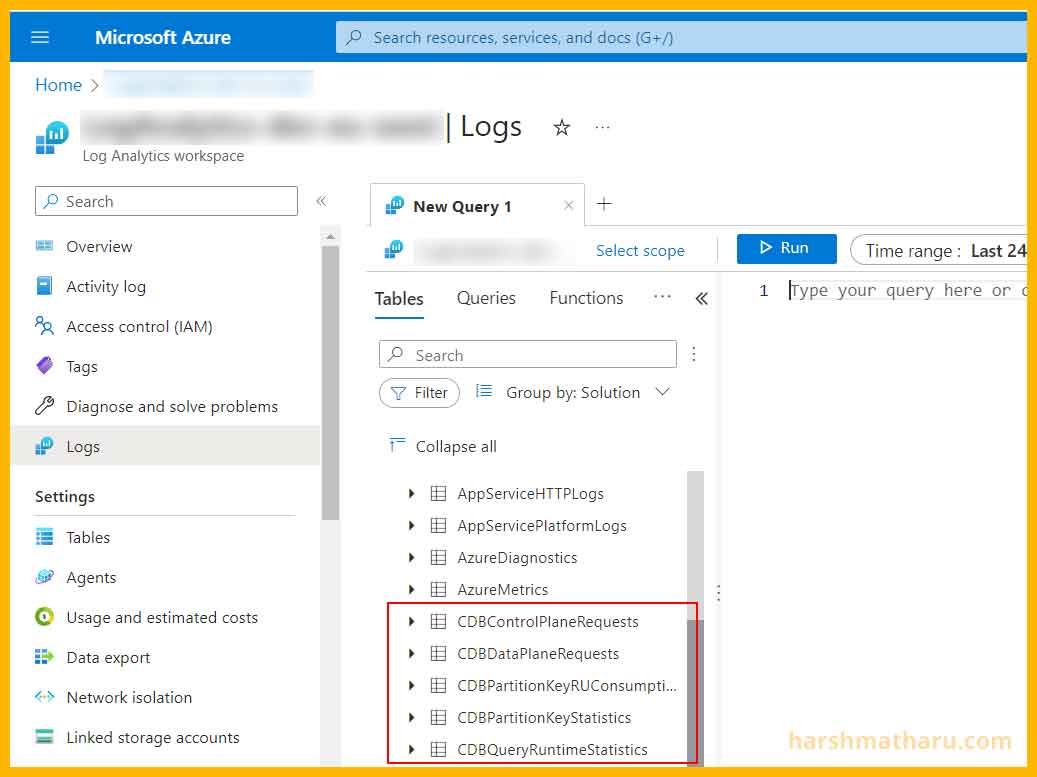
You can expand the tables to view all the columns inside the tables.
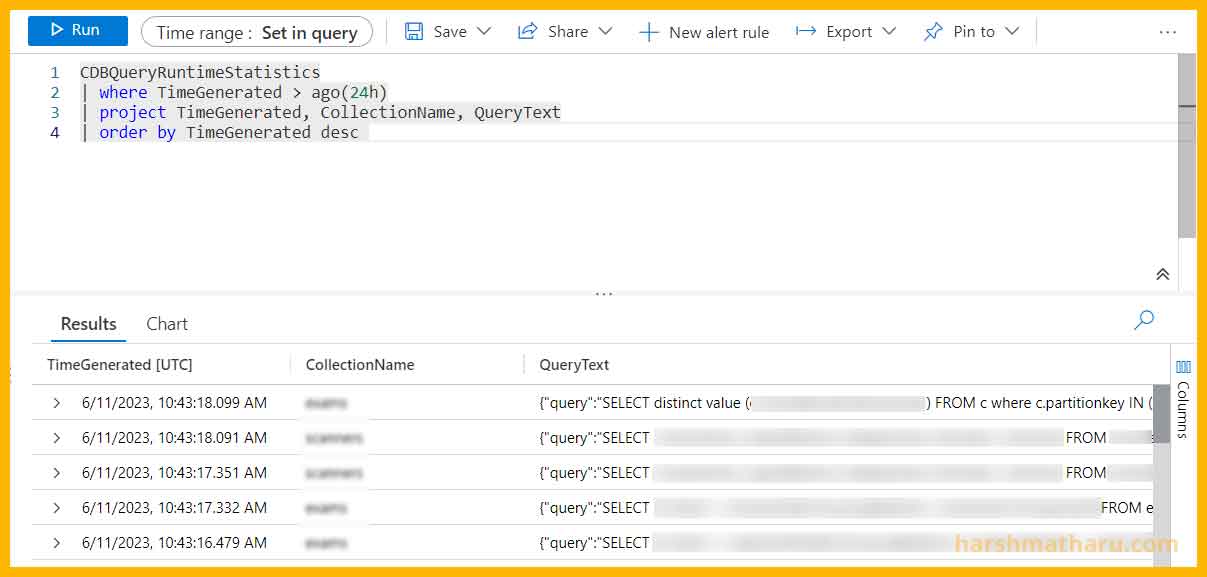
List all queries executed in last 24 hours
CDBQueryRuntimeStatistics
| where TimeGenerated > ago(24h)
| project TimeGenerated, CollectionName, QueryText
| order by TimeGenerated desc
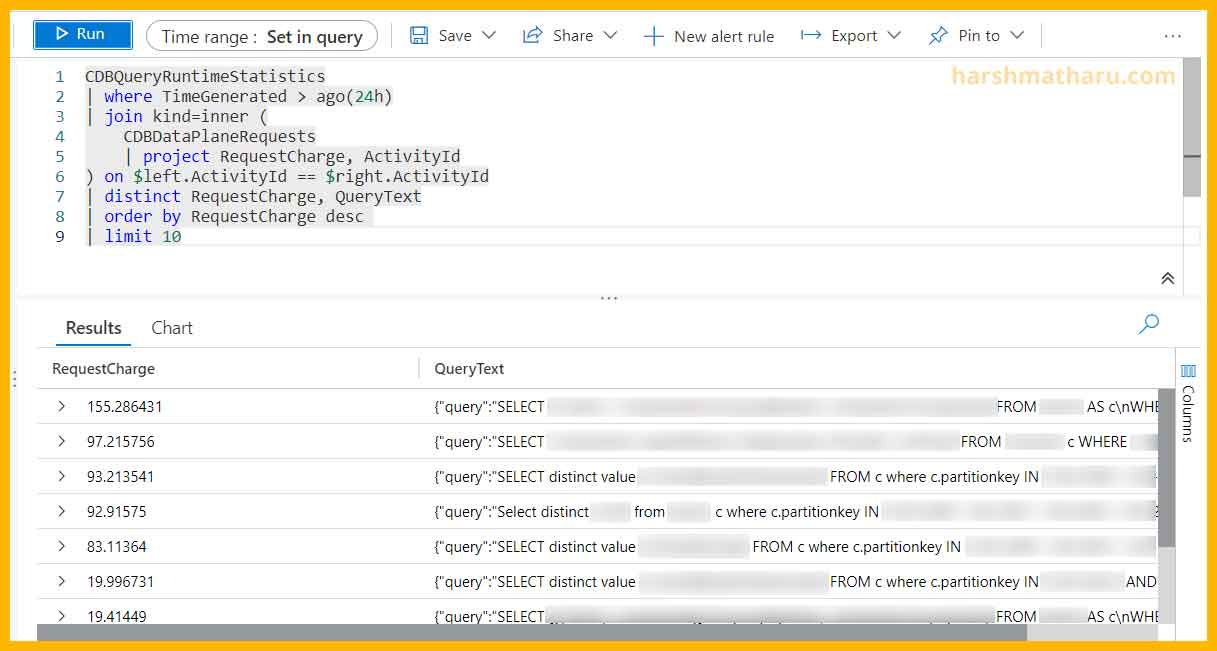
List top 10 queries which consumes the most RUs
CDBQueryRuntimeStatistics
| where TimeGenerated > ago(24h)
| join kind=inner (
    CDBDataPlaneRequests
    | project RequestCharge, ActivityId
) on $left.ActivityId == $right.ActivityId
| distinct RequestCharge, QueryText
| order by RequestCharge desc
| limit 10
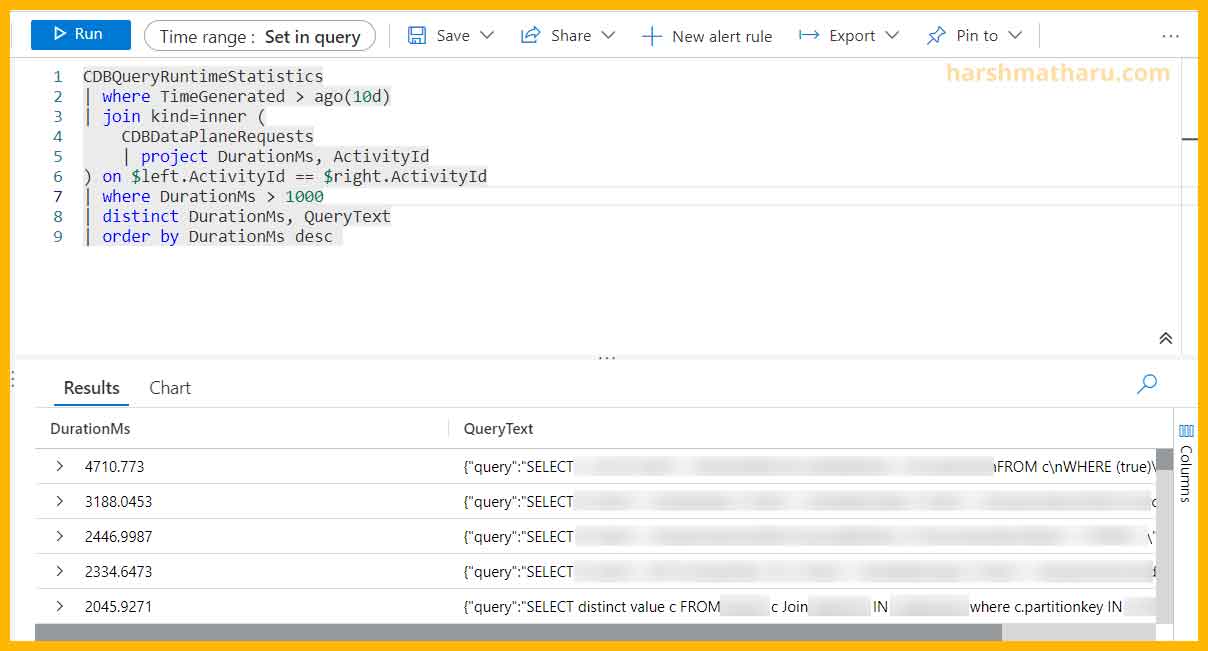
View all queries which are taking more than 1 second to execute
CDBQueryRuntimeStatistics
| where TimeGenerated > ago(10d)
| join kind=inner (
    CDBDataPlaneRequests
    | project DurationMs, ActivityId
) on $left.ActivityId == $right.ActivityId
| where DurationMs > 1000
| distinct DurationMs, QueryText
| order by DurationMs desc
Conclusion
In conclusion, this blog post provided a step-by-step guide on how to enable and view logs from Cosmos DB. The process involved creating a Log Analytics Workspace, enabling logs from Cosmos DB by creating a Diagnostic setting. The blog also shared example queries for listing executed queries in the last 24 hours, identifying the top 10 queries consuming the most RUs, and finding queries taking more than 1 second to execute. By following this guide, users can effectively monitor and analyze the logs from their Cosmos DB deployment.